
Predictive maintenance for rotating equipment: rugged vibration acquisition with Python in 10 minutes
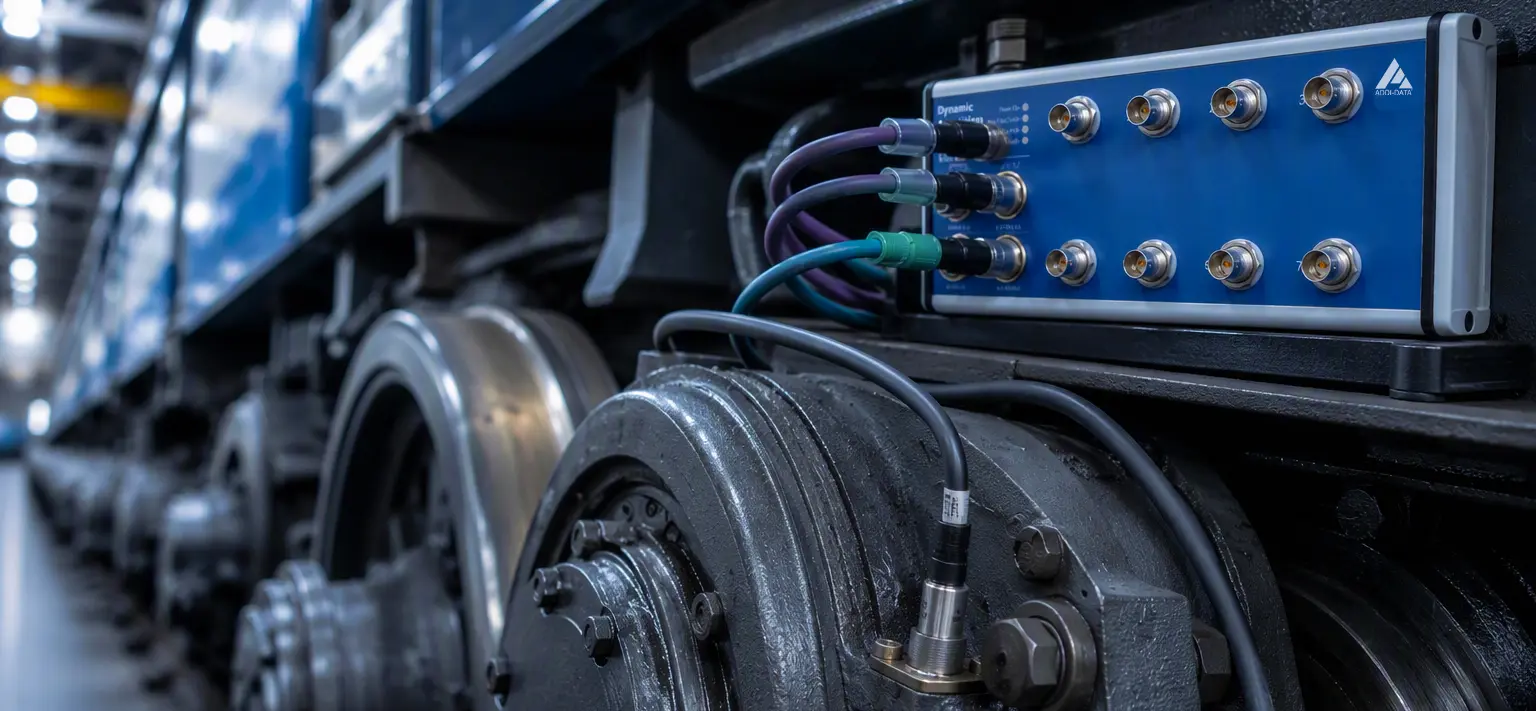
An operator of critical rotating machinery specialized in rail rolling stock running assets such as bearings, gearboxes and drivetrains around the clock. Uptime and safety are non-negotiable: an unplanned stop halts production or takes an asset out of service, with direct cost, contractual penalties and reputational impact.
1. Challenge
Reliable vibration monitoring is difficult in harsh industrial environments such as those encountered with rail rolling stock. Long analog cables can degrade sensitive accelerometer signals, while advanced machine diagnostics require simultaneous, phase-true acquisition across multiple channels.
Measurement points are distributed across the asset, installation space is scarce, and the environment is rough: vibration, temperature swings, dirt and water. And there is a second, quieter cost: every engineering hour spent taming the measurement chain is an hour not spent on the diagnosis itself.
What is needed is acquisition that is rugged, compact and mounted close to the sensors.
2. Solution
Instead of pulling long cables back to a cabinet, the acquisition is placed directly at the machine.
The ADDI-DATA MSX-E3601 provides a rugged, IP65 metal-housed node (−40 to +85 °C) accepts the ICP®/IEPE accelerometers directly, without external signal conditioner and digitises every channel simultaneously in 24-bit, up to 128 kHz with anti-aliasing, so the vibration signature is captured phase-true.
Nodes connect over standard Ethernet, are synchronized to the microsecond and cascade through an integrated switch, so coverage scales from a couple of points to the whole asset. On-board processing buffers and pre-conditions the data at the edge before it reaches the maintenance/analytics layer, turning raw vibration into an early-warning signal.
Where does it fit in your architecture? Your sensors stay yours. Your control system and your IT stack stay yours, unchanged. The MSX-E3601 owns the level in between (acquisition) and hands over data that is already correct: in volts, phase-true, timestamped.
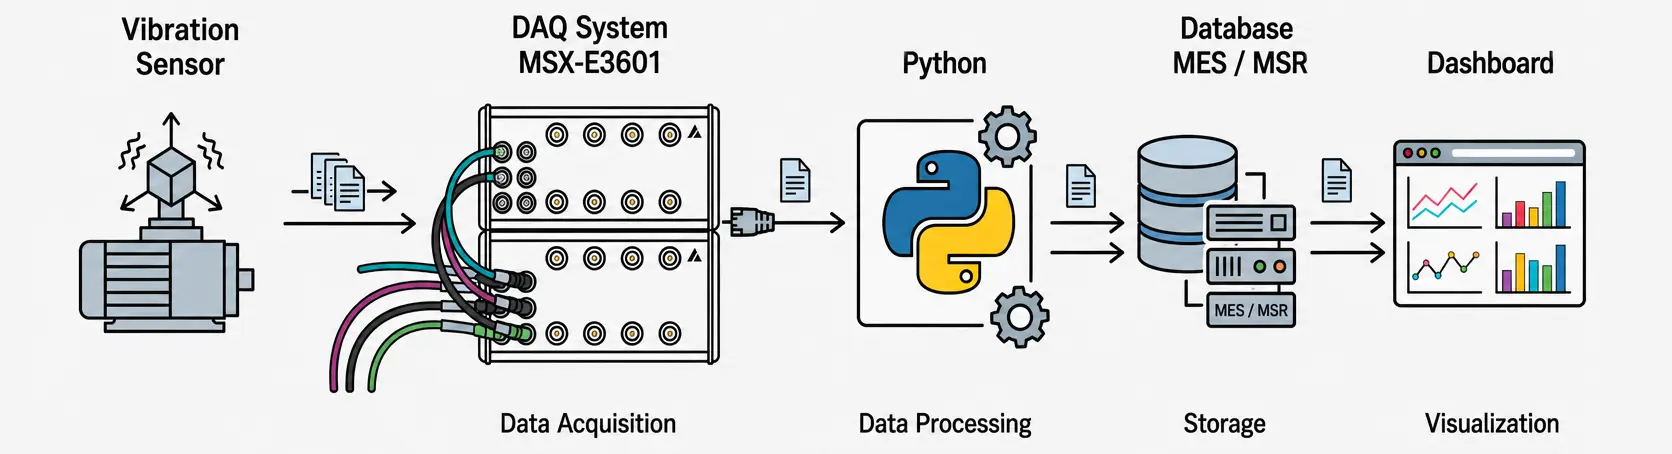
Combined with our open-source Python SOAP API, users go from unboxing to live data acquisition in under 5 minutes without proprietary software required.
Key features
- 24 V digital trigger input
- 8 or 2 current sources for ICP® or IEPE sensors
- ARM®9 32-bit processor
- 64 MB onboard SDRAM for storing data
- Robust standardized metal housing
- Power Save Mode: Reduced power consumption when
- no acquisition runs
3. Five-Minute Quick Start
Step 1: Configure MSX-E
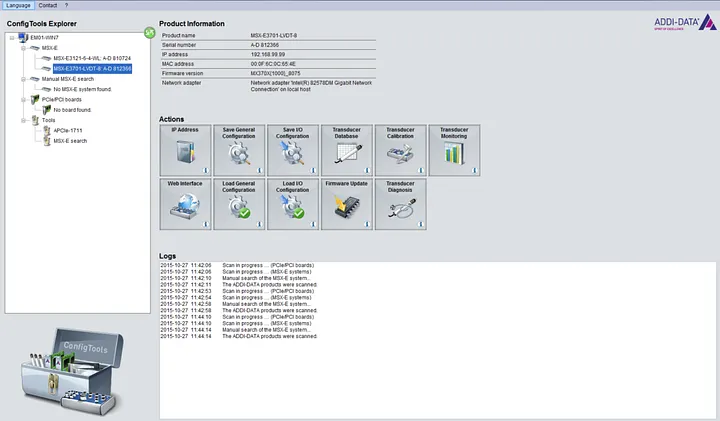
Connect the MSX-E3601 to your Ethernet network. The module ships with a default IP address. Configure it to match your network using the ADDI-DATA Config Tools.
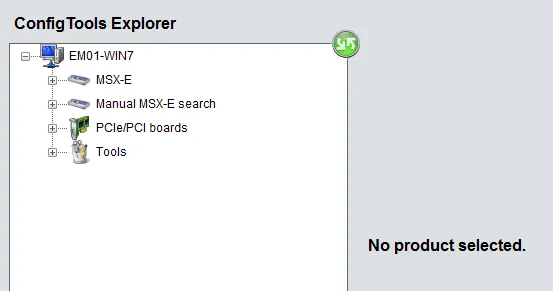
Overview ConfigTools window
Step 2: Install Zeep for SOAP
Clone the open-source samples from github.com/ADDI-DATA/msxe-samples and install the two runtime dependencies:
pip install zeep numpyThe WSDL service definitions are bundled with the API, the client starts fully offline, with no internet access and no proxy configuration.
Step 3: First capture: four accelerometers, one call
This is the real API, not pseudocode. One call opens the data stream, captures a phase-true block on four ICP®/IEPE accelerometers at 50 kS/s per channel, then stops and cleans up:
from msxe_api import MSXE3601API
from msxe_api.msxe3601 import GAIN_X1, COUPLING_AC, INPUT_SE
msxe = MSXE3601API("192.168.99.99")   # SOAP control :5555, data stream TCP :8989
volts, meta = msxe.acquire_finite(
    channels=[0, 1, 2, 3],
    frequency_hz=50000.0,
    n_sequences=4096,          # samples per channel
    gains=GAIN_X1,
    coupling=COUPLING_AC,      # AC coupling for accelerometers
    input_type=INPUT_SE,
    icp=True,                  # sensor powered by the module
)
print(volts.shape)             # (4096, 4) float32 — already in volts
The heavy sample data does not travel over SOAP: it streams over the module’s dedicated data server (raw TCP), so control traffic and measurement data never compete.
Step 4: Stream continuously into your own analysis
For monitoring, register a callback and stream without limit. Each block arrives as a NumPy array already in volts, run your FFT, envelope or band-RMS analysis directly on it:
import numpy as np
def on_block(volts, meta):
    rms = np.sqrt((volts.astype(np.float64) ** 2).mean(axis=0))
    print("  ".join(f"Ch{c}: {r:.4f} Vrms" for c, r in enumerate(rms)))
    # your FFT / envelope / band-RMS analysis goes here
    # return False to stop; None keeps streaming
msxe.acquire_continuous(
    on_block, channels=[0, 1, 2, 3], frequency_hz=50000.0,
    block_sequences=2048, gains=GAIN_X1, coupling=COUPLING_AC, icp=True,
)
The stream always shuts down cleanly, on a callback stop, on an exception, or on Ctrl+C the sequence is stopped and the socket closed, so the next start never finds the module blocked.
Step 5: Live Dashboard
Install matplotlib and run the dashboard sample for visualization:
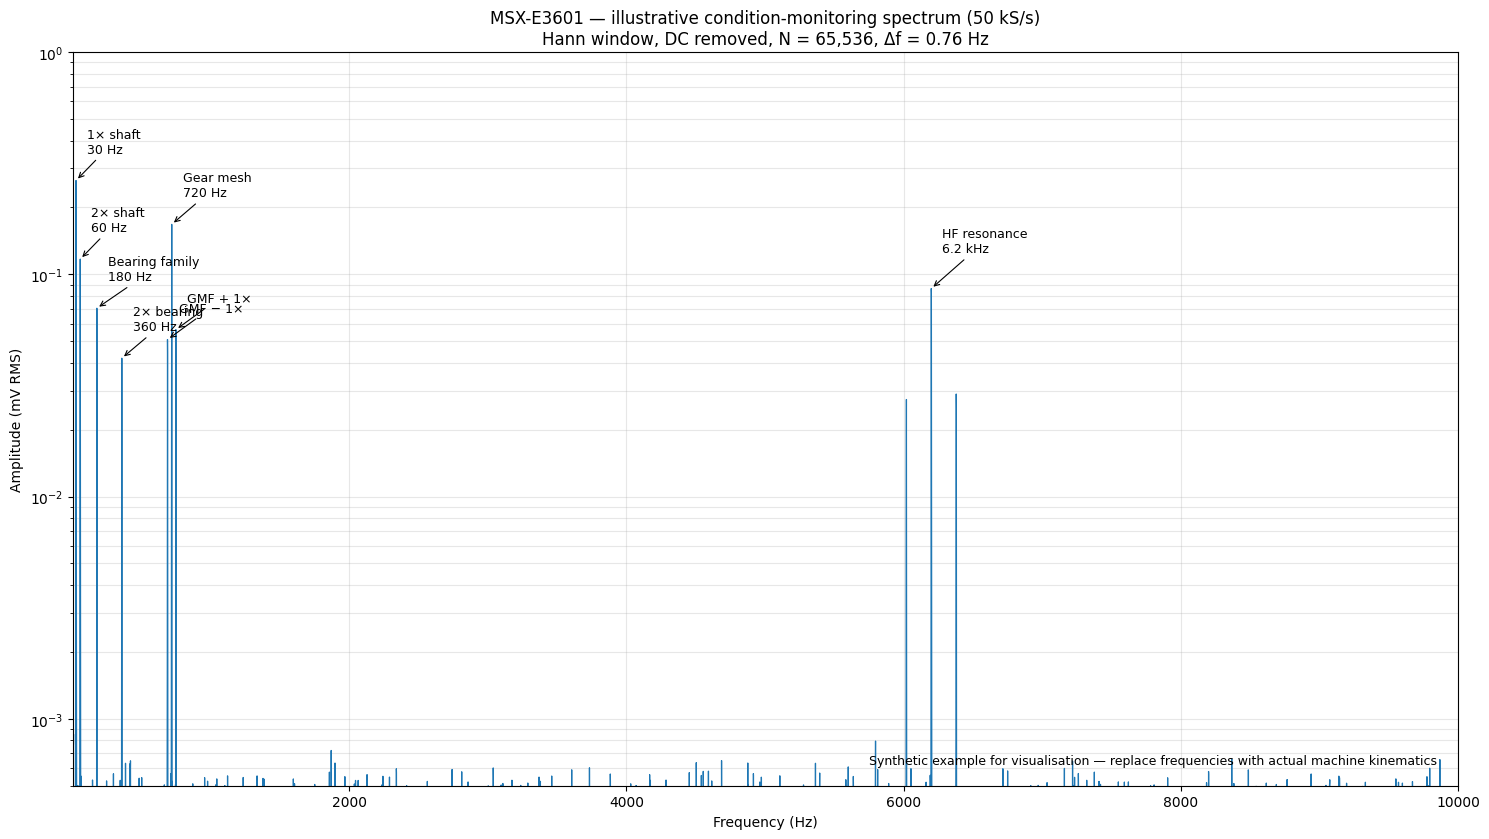
import numpy as np
import matplotlib.pyplot as plt
volts, _ = msxe.acquire_finite(
    channels=[0], frequency_hz=50000.0, n_sequences=8192,
    gains=GAIN_X1, coupling=COUPLING_AC, input_type=INPUT_SE, icp=True,
)
signal = volts[:, 0] - volts[:, 0].mean()      # remove the DC offset
# Hann window with amplitude correction — peaks read in true volts
window = np.hanning(len(signal))
amplitude = np.abs(np.fft.rfft(signal * window)) / (len(signal) * window.mean())
amplitude[1:] *= 2
amplitude[-1] /= 2                             # Nyquist bin is not mirrored
frequency = np.fft.rfftfreq(len(signal), d=1 / 50000.0)
fig, (ax_t, ax_f) = plt.subplots(2, 1, figsize=(11, 7))
ax_t.plot(np.arange(len(signal)) / 50.0, signal, lw=0.6)
ax_t.set(xlabel="time (ms)", ylabel="amplitude (V)", title="Time domain")
ax_f.plot(frequency, amplitude, lw=0.8)
ax_f.set(xlabel="frequency (Hz)", ylabel="amplitude (V)",
         title="Amplitude spectrum — Hann window, \u0394f \u2248 6 Hz")
plt.tight_layout(); plt.show()
A live chart window opens showing all vibration channels updating in real time. Close the window to stop acquisition.
Step 6: From samples to your monitoring stack
The repository ships a complete, runnable sample suite for the MSX-E3601. Every sample reads the device address from the environment and is commented step by step:
| Sample | What it shows |
|---|---|
| sample_acquisition_finite.py | Finite capture saved to capture.npy / capture.csv, straight into pandas, Excel or any BI tool |
| sample_acquisition_continuous.py | Continuous streaming with live per-channel RMS |
| sample_acquisition_callback.py | Streaming into your own callback |
| sample_iepe_accelerometer.py | ICP®/IEPE accelerometer capture, sensor powered by the module |
| sample_advanced_acquisition.py | Mixed gains, differential inputs and hardware timestamps |
| sample_triggered_acquisition.py | Capture gated on the 24 V hardware trigger input |
The CSV output imports into Excel, pandas or Grafana as-is; the continuous stream feeds a time-series database or ML pipeline directly.
4. API Highlights
The Python API is designed for simplicity. A few operations that do exactly what they say:
| Operation | What it does |
|---|---|
| acquire_finite(…) | 1. open stream 2. capture exactly N sequences 3. stop 4. close. 5. Returns (volts, meta) as NumPy float32 in volts. |
| acquire_continuous(callback, …) | Unbounded streaming; every block delivered to your callback; sequence stopped and socket closed on any exit path. |
| init_and_start_sequence() / get_sequence_status() / stop_and_release_sequence() | Full manual control when you need custom acquisition logic. |
| Per-channel configuration | Gain ×1/×10/×100, AC/DC coupling, single-ended/differential, ICP® on/off (one value for all channels or a per-channel dict) |
| Metadata | Optional hardware timestamps, sequence counter and trigger flags delivered alongside the samples. |
| Offline by design | WSDLs bundled with the package, the client constructs with no internet access |
5. Supported Configurations
| Version | Channels | Sensor Types | Typical Applications |
|---|---|---|---|
| MSX-E3601 | 8 SE/diff. inputs | ICP® or IEPE sensors | Noise & vibration measurement |
| MSX-E3601-2 | 2 SE/diff. inputs | ICP® or IEPE sensors | Noise & vibration measurement |
6. Benefits of AI-powered Condition Monitoring
Because the data leaves the module as clean and timestamped, it feeds an AI-based monitoring layer without any preparation. For example, combined with Grafana and its machine-learning tooling:
- Automatic anomaly detection: Identify unusual vibration patterns and gradual changes in machine behaviour.
- Equipment degradation forecasting: Use historical condition indicators to anticipate potential failures.
- Smarter alerts: Detect deviations before critical thresholds are reached and reduce false alarms.
- Earlier fault detection: Help maintenance teams anticipate bearing, gearbox or drivetrains failures.
- Predictive maintenance strategy: Move from scheduled or reactive interventions to targeted, condition-based maintenance.
7. Three ways to start, depending on where you sit:
You run a test bench or a validation programme?
Validate the technology on your own application before committing budget.
We provide a free loan unit with a working example tailored to your measurement task, support you in meeting your target performance, and provide the documentation required for your internal validation process.
Prove the concept first. Invest later.
You integrate condition monitoring for your customers?
Start with a documented and proven building block.
Request our reference architecture, including hardware, Python API, sample code and integration guidance. You benefit from predictable commissioning, clearly defined interfaces, and lifecycle commitments.
Reduce risk. Accelerate deployment.
You build the machine?
Integrate once and rely on it for the lifetime of your machine.
We support your design-in with product variants, dedicated part numbers and custom firmware whenever the standard offering does not fully match your requirements. Long-term availability and lifecycle commitments are provided in writing.
A measurement platform designed for long-term machine programmes.
8. Get Started
Download the Python API and samples from our GitHub repository:
- GitHub: https://github.com/ADDI-DATA/msxe-samples
- ConfigTools: https://www.addi-data.com/configtools
- Documentation: See README.md in the repository for full API reference
For technical support, please contact: [email protected]
Would you like to learn more?
If you want to learn more about the MSX-E3601, you can find additional information directly on the product page.
ADDI-DATA SOLUTION
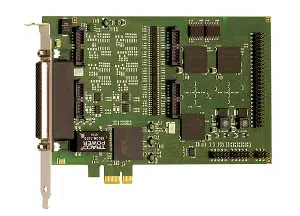
DAQ cards
• For various signal types
• High precision
• Robust and interference-resistant
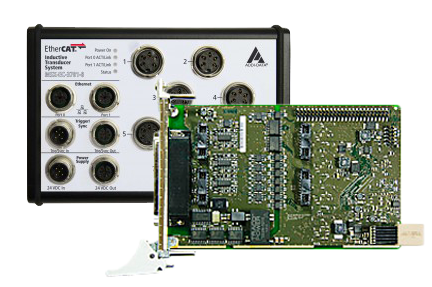
Real-time systems
• EtherCAT and Profinet
• Linux systems including real-time extension
• PC boards with RTX real-time drivers
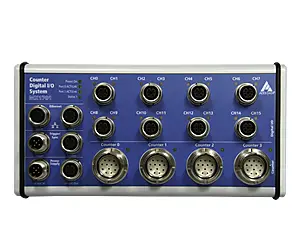
Ethernet systems
• Direct sensor connection
• Onboard calculation of the acquired data
• For use in the field, up to IP 67
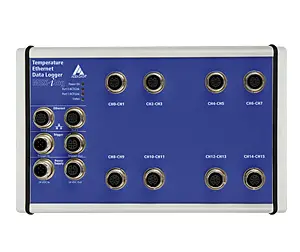
Data loggers
• Long-term data acquisition of numerous signal types
• Setup of the measurement device without programming knowledge
• Visualisation of the live data
Customized solutions
The best solution often is customized. As a manufacturer, we are able to adapt our solutions as closely as possible to your requirements. We are pleased to advise you on finding the best solution for your applications and to perform the necessary adaptations for you.
Just ask us!